Definitely Resource related. SSH in and load TOP and monitor the resource usage while accessing the wordpress dashboard.
What do you mean by TOP?
top is a command utility to view processes.
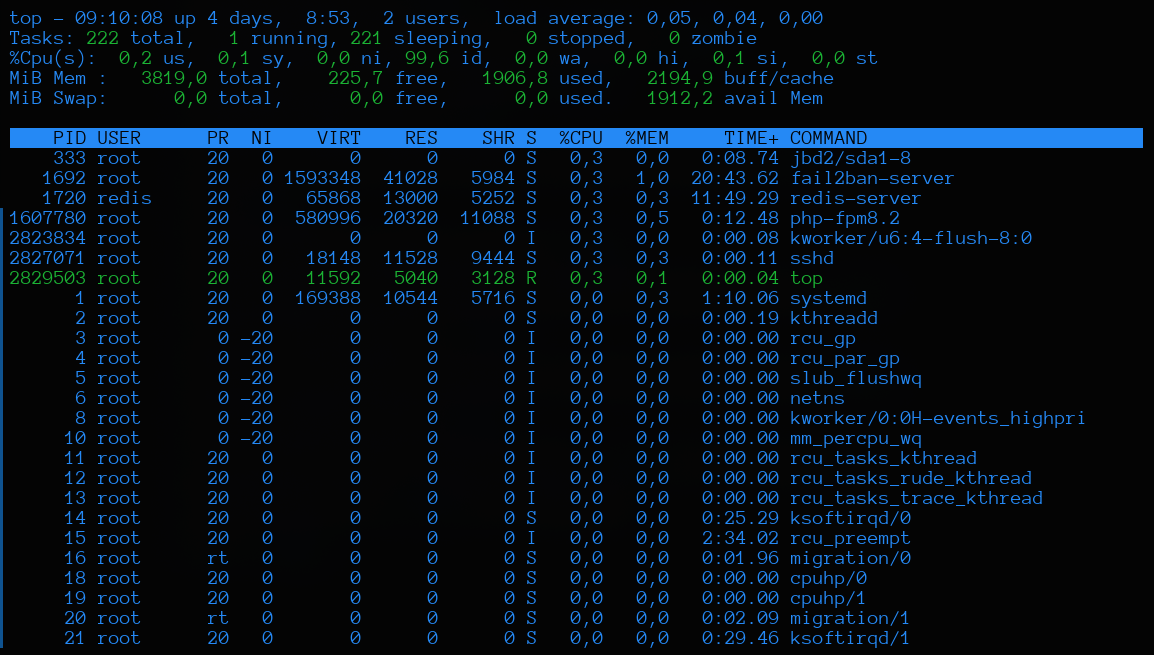
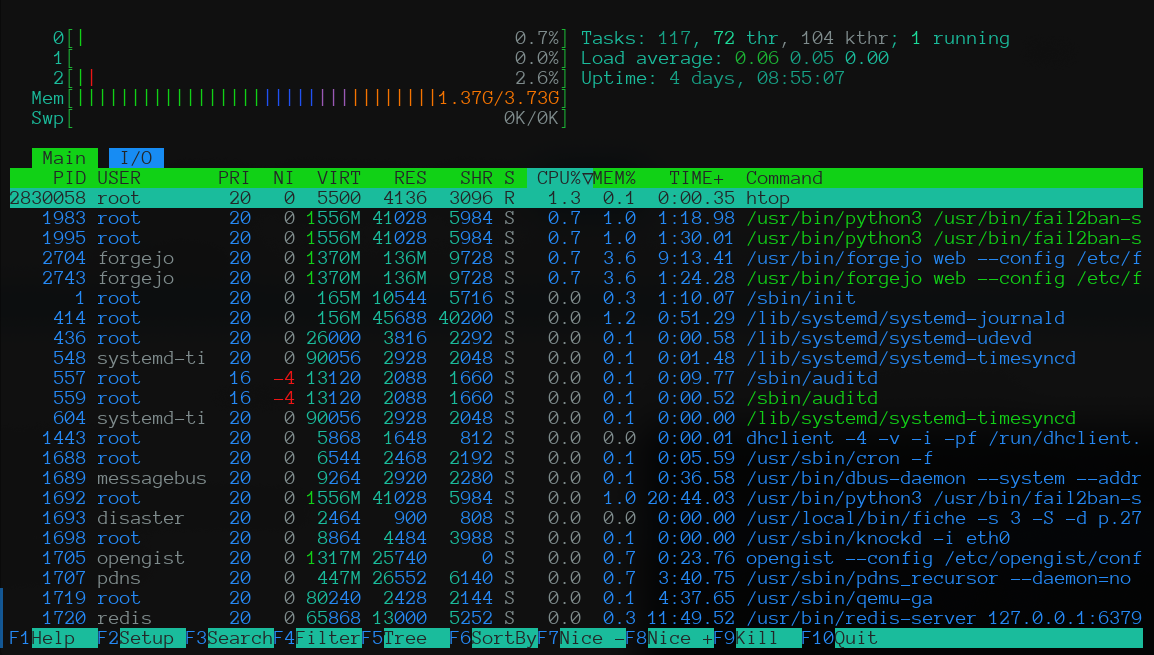
You can also use htop, it is a bit more visual, you can scroll vertically and horizontally, etc. (sudo apt install htop -y):
2 Likes
htop is better ![]()
![]()
![]()
1 Like
Thanks!
I will try to use this command to check.
1 Like
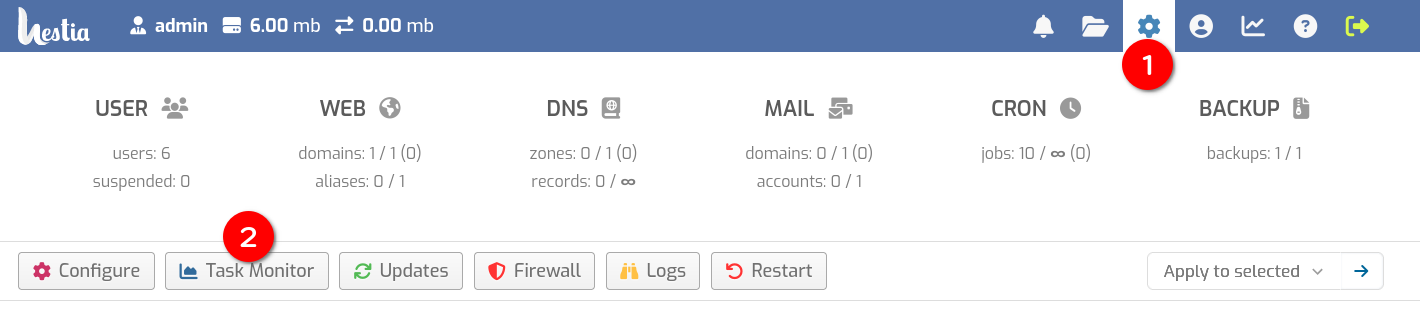
In hestiacp you can see the server stats including CPU load
You can also use the uptime command in the CLI that displays the load average for the last minute, 5 minutes and 10 minutes
1 Like
Which tab in Hestia can let me check the server stats including CPU load?
Thanks!
hello i have same problem with save and edit in wordpress… Do you find any solution to fix that ? Please give me your contact… Thanks!
I think it would be great if someone could post a guide/tutorial on the forum to run Wordpress in HestiaCP in a very fast way in terms of speed and page loading. For example by using and installing redis, cache, cdn and others with HestiaCP. Additional options by using some good Wordpress plugins.
3 Likes
Can you share what’s the server’s config? also that 512M allocated to PHP seems quite a lot!
Having said that - if you have 2-4gb ram - then I’ll certainly suggest installing Redis and configuring Redis for Database and object cache with W3 Total Cache plugin for WordPress
These is my usual/default/must-have setup for WordPress installation for speed (Improvement needed)
Plugins
- If Using Litespeed webserver: Litespeed-cache otherwise WP Super Cache, W3 Total Cache and/or Cloudflare
Optional
- Redis Cache for large & busy sites
- Query Monitor for DB & Error Monitoring
Any other suggestions, please add.