This is a bit over my head and I’m not sure how to deal with it or why it’s happening. I noticed this change since upgrading to HestiaCP 1.4.2 and running the latest apt update && apt upgrade. I’m not sure if it’s related to the updates or the firewall issue that happened, but since the update, the server response has become quite junk.
When opening the website in a new tab, there is at least a 1-2 second delay before the page even starts to get served. I have never had this issue before, so not sure how to even begin troubleshooting or dealing with this. Any advice/help would be greatly appreciated.
The quickest and easiest thing I thought to do to confirm the issue was a quick ping check. The response times are all over the place. This is a DigitalOcean Basic droplet. Any ideas what is going on?
PING srv01.mydomain.com (192.241.xxx.xxx): 56 data bytes
64 bytes from 192.241.xxx.xxx: icmp_seq=0 ttl=53 time=16.659 ms
64 bytes from 192.241.xxx.xxx: icmp_seq=1 ttl=53 time=22.654 ms
64 bytes from 192.241.xxx.xxx: icmp_seq=2 ttl=53 time=125.929 ms
64 bytes from 192.241.xxx.xxx: icmp_seq=3 ttl=53 time=41.961 ms
64 bytes from 192.241.xxx.xxx: icmp_seq=4 ttl=53 time=71.099 ms
64 bytes from 192.241.xxx.xxx: icmp_seq=5 ttl=53 time=29.656 ms
64 bytes from 192.241.xxx.xxx: icmp_seq=6 ttl=53 time=21.808 ms
64 bytes from 192.241.xxx.xxx: icmp_seq=7 ttl=53 time=193.792 ms
64 bytes from 192.241.xxx.xxx: icmp_seq=8 ttl=53 time=35.510 ms
64 bytes from 192.241.xxx.xxx: icmp_seq=9 ttl=53 time=188.681 ms
64 bytes from 192.241.xxx.xxx: icmp_seq=10 ttl=53 time=357.647 ms
64 bytes from 192.241.xxx.xxx: icmp_seq=11 ttl=53 time=164.451 ms
64 bytes from 192.241.xxx.xxx: icmp_seq=12 ttl=53 time=24.141 ms
64 bytes from 192.241.xxx.xxx: icmp_seq=13 ttl=53 time=73.699 ms
64 bytes from 192.241.xxx.xxx: icmp_seq=14 ttl=53 time=312.620 ms
64 bytes from 192.241.xxx.xxx: icmp_seq=15 ttl=53 time=65.861 ms
64 bytes from 192.241.xxx.xxx: icmp_seq=16 ttl=53 time=136.703 ms
Request timeout for icmp_seq 17
Request timeout for icmp_seq 18
64 bytes from 192.241.xxx.xxx: icmp_seq=18 ttl=53 time=1405.744 ms
64 bytes from 192.241.xxx.xxx: icmp_seq=19 ttl=53 time=413.998 ms
64 bytes from 192.241.xxx.xxx: icmp_seq=20 ttl=53 time=114.804 ms
64 bytes from 192.241.xxx.xxx: icmp_seq=21 ttl=53 time=20.028 ms
64 bytes from 192.241.xxx.xxx: icmp_seq=22 ttl=53 time=16.466 ms
64 bytes from 192.241.xxx.xxx: icmp_seq=23 ttl=53 time=446.430 ms
64 bytes from 192.241.xxx.xxx: icmp_seq=24 ttl=53 time=49.857 ms
64 bytes from 192.241.xxx.xxx: icmp_seq=25 ttl=53 time=18.430 ms
64 bytes from 192.241.xxx.xxx: icmp_seq=26 ttl=53 time=51.097 ms
64 bytes from 192.241.xxx.xxx: icmp_seq=27 ttl=53 time=326.492 ms
64 bytes from 192.241.xxx.xxx: icmp_seq=28 ttl=53 time=19.826 ms
64 bytes from 192.241.xxx.xxx: icmp_seq=29 ttl=53 time=1195.228 ms
64 bytes from 192.241.xxx.xxx: icmp_seq=30 ttl=53 time=191.375 ms
64 bytes from 192.241.xxx.xxx: icmp_seq=31 ttl=53 time=964.346 ms
64 bytes from 192.241.xxx.xxx: icmp_seq=32 ttl=53 time=87.749 ms
64 bytes from 192.241.xxx.xxx: icmp_seq=33 ttl=53 time=25.298 ms
64 bytes from 192.241.xxx.xxx: icmp_seq=34 ttl=53 time=36.335 ms
64 bytes from 192.241.xxx.xxx: icmp_seq=35 ttl=53 time=22.601 ms
64 bytes from 192.241.xxx.xxx: icmp_seq=36 ttl=53 time=72.983 ms
64 bytes from 192.241.xxx.xxx: icmp_seq=37 ttl=53 time=33.133 ms
64 bytes from 192.241.xxx.xxx: icmp_seq=38 ttl=53 time=93.367 ms
64 bytes from 192.241.xxx.xxx: icmp_seq=39 ttl=53 time=91.449 ms
64 bytes from 192.241.xxx.xxx: icmp_seq=40 ttl=53 time=31.726 ms
64 bytes from 192.241.xxx.xxx: icmp_seq=41 ttl=53 time=58.082 ms
64 bytes from 192.241.xxx.xxx: icmp_seq=42 ttl=53 time=24.660 ms
64 bytes from 192.241.xxx.xxx: icmp_seq=43 ttl=53 time=55.121 ms
64 bytes from 192.241.xxx.xxx: icmp_seq=44 ttl=53 time=80.037 ms
64 bytes from 192.241.xxx.xxx: icmp_seq=45 ttl=53 time=99.905 ms
64 bytes from 192.241.xxx.xxx: icmp_seq=46 ttl=53 time=25.031 ms
64 bytes from 192.241.xxx.xxx: icmp_seq=47 ttl=53 time=84.230 ms
64 bytes from 192.241.xxx.xxx: icmp_seq=48 ttl=53 time=20.230 ms
64 bytes from 192.241.xxx.xxx: icmp_seq=49 ttl=53 time=334.159 ms
64 bytes from 192.241.xxx.xxx: icmp_seq=50 ttl=53 time=45.977 ms
64 bytes from 192.241.xxx.xxx: icmp_seq=51 ttl=53 time=19.403 ms
64 bytes from 192.241.xxx.xxx: icmp_seq=52 ttl=53 time=52.481 ms
64 bytes from 192.241.xxx.xxx: icmp_seq=53 ttl=53 time=46.201 ms
64 bytes from 192.241.xxx.xxx: icmp_seq=54 ttl=53 time=130.895 ms
64 bytes from 192.241.xxx.xxx: icmp_seq=55 ttl=53 time=115.538 ms
64 bytes from 192.241.xxx.xxx: icmp_seq=56 ttl=53 time=282.078 ms
64 bytes from 192.241.xxx.xxx: icmp_seq=57 ttl=53 time=430.365 ms
64 bytes from 192.241.xxx.xxx: icmp_seq=58 ttl=53 time=723.660 ms
64 bytes from 192.241.xxx.xxx: icmp_seq=59 ttl=53 time=21.233 ms
64 bytes from 192.241.xxx.xxx: icmp_seq=60 ttl=53 time=17.494 ms
64 bytes from 192.241.xxx.xxx: icmp_seq=61 ttl=53 time=113.627 ms
64 bytes from 192.241.xxx.xxx: icmp_seq=62 ttl=53 time=72.302 ms
64 bytes from 192.241.xxx.xxx: icmp_seq=63 ttl=53 time=102.368 ms
64 bytes from 192.241.xxx.xxx: icmp_seq=64 ttl=53 time=79.455 ms
64 bytes from 192.241.xxx.xxx: icmp_seq=65 ttl=53 time=23.061 ms
64 bytes from 192.241.xxx.xxx: icmp_seq=66 ttl=53 time=51.740 ms
64 bytes from 192.241.xxx.xxx: icmp_seq=68 ttl=53 time=703.768 ms
that is most likely not related to your droplet or software on it then. a ping does not give enough information, you rather need a traceroute or even better mtr to better see, where packet loss might occur on the way to your server.
you also want to verify that this happens from other places too and not just from your ISP…
routing/peering can be complex and issue tend to be temporary. that said, you can only start looking more closer to the routes and more often…
Thanks @falzo. It seems to have returned to what I guess can be considered normal. I’m seeing response times in the range of 17-30. It must have just been a sudden spike of traffic or something. I’ve just noticed it randomly happening more frequently. I’ll monitor and look into it a bit more.
I was blocking a few of the countries with the firewall using the IP lists, and wasn’t sure if that was slowing things down as it put more strain on the server to do a bigger IP lookup with every request. I don’t understand this part of the server administration stuff as much, so just thought I would ask.
I was just seeing massively wide swings of the response time and it was not stablizing, that’s why I asked. It seems to have stabilized, so perhaps it was just a load on the server or my ISP, etc.
This process is very lightweight. You should benefit from not having to deal from hack attempts from those countries. Usually you will have better performance.
Thanks for confirming. I will re-enable those then. Any advice on things that I could check when I do see the spikes in poor response time. Something to at least understand what is causing it or why. If its just that web traffic is picking up and I need to upgrade the virtual server’s ram/cpu, that’s a good problem to have. I just don’t know what is the cause, so can’t think of what the correct course of action is.
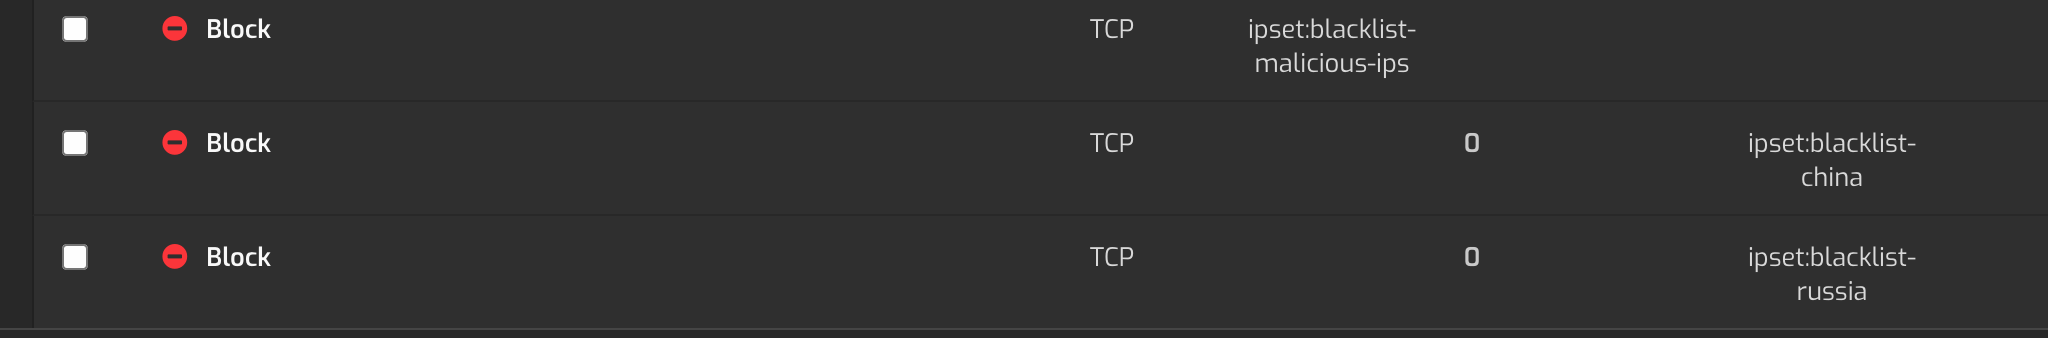
@jlguerrero - Actually, I just noticed something quite strange. I was trying to add back a few firewall block rules for the country IP sets. I noticed that the one I previously added, the “malicious IP list” had no port number listed. Maybe the latest Hestia 1.4.2 has a check now, but it seems when I tried to add the new rules, it stopped me from adding a new rule without specifying the port. So now I’m using port 0, to I assume apply to all ports.
So does this mean that these were previously not being blocked? Which I guess might make sense, because I was wondering why I was getting Wordpress WordFence reports showing blocked attacks from Russian Ip addresses. I had not gotten around to looking into it, but it was confusing when I saw it, as I assumed there shouldn’t be any logs of Russian IP attacks since I had a rule to block all traffic from Russia.
Here is a screenshot of my Hestia backend. Notice how the Malicious IP list does not have a port number listed. It doesn’t appear possible to add such a record now through the Hestia interface. Was this something that was missed in the previous version. I think I started within using 1.3.5.
yep, htop was the first thing i looked at, which showed low CPU and ram. Load average has been hovering around 0.11 - 0.17 with ram only utilized at 733MB / 2 GB with Swap at 0MB / 2GB. That’s why I was confused. No load on server, no apparent reason for why the delay.
Very strange. I will read more about how to use traceroute to investigate. It is quite bizarre. Obviously, I wanted to just search google for something like “slight delay at initial request to load website, why?” but then you just get a bunch of pages talking about website speed performance and how to reduce the page load.
But the issue is not with the website size or page loading, it appears to be between the time user is requesting the website and when the server starts to respond. I’m not very familiar with php-fpm and workers/max_children, so I thought perhaps it could be something related to that. I wish I had a bit more experience and knowledge on this particular area, but I don’t .
@jlguerrero - Ah, one more follow up question to the firewall rule stuff. Do you recommend creating a rule for each IP set for both TCP and UDP, or is just adding the ALL ports for TCP to block the blacklisted IPs enough.
well, the good news is. I guess I should expect to get a lot less bullshit traffic on my site now. haha. I’m happy the Hestia team added in this check on the GUI. Otherwise I wouldn’t have known that I made this mistake.
as said before nothing wrong with your server, low CPU and ram usage confirms that.
ping is not an appropriate tool to check for network issues, it’s barely an indicator and even if it were for high load or lots of traffic it is the last thing where you would really see anything.
also got nothing to do with your firewall settings. check the routes when the problem comes back, there is something happening on the way.
It seems the issue may be related to the pm.max_children setting. I recently changed it from 8 to 12 for one of the websites on my server, as I was getting an increasing number of “reached max_children” warnings in the apache logs.
I noticed that this site was the only one experiencing the slow to respond issue (i.e. when clicking an link to another internal website page, it would sometimes take 1 or 2 seconds before the page even attempted to load). This was the issue I tried to explain above.
I don’t understand the php-fpm stuff enough to know why. But it seems it’s related, as I changed it back to 8 and restarted the services and now the lag is gone.
Does this make sense? I guess, I will need to upgrade the server if I keep getting max_children warnings, as it seems if I increase the number, other things start to mess up.
Children processes consume both CPU and RAM. If you raise the thereshold to 12 for example, you will be consuming more CPU and RAM but the web server (nginx or apache) will not protect your system and will not reject requests. It will simply try to serve them with insufficient server resources.
If children take less time to complete requests you will not be hitting that thereshold or even better, your web server doesn’t have to deal with many of those requests.
You can try to:
Use better code if possible
Use cache: to avoid having to use the database and to execute php code
Use a modern php version
Optimize the database: usually the bottleneck
Get more CPUs
Get more RAM space: maybe you can’t have more children because you run out of memory
yes, unrelated to the ping/possible network issues you saw, it could totally be the case, that you run into php related limits, if you have quite some traffic hitting your site.
that it is only one page affected also kinda confirms that. of course you can raise the limits a bit, as long your ressources on the VM allow for that. however, you more likely want to find which requests are coming in, that require long running php. maybe these php request get even stuck or block each other if somehow the connection is kept alive too long etc.
for starters check the apache/nginx log for that domain for the occurence of larger amounts of POST requests, as that is a behaviour you might see quite often from bots and that also can lead to a higher php process count.
if you are lucky you can even narrow it down to a few single IPs causing the trouble and block them directly (or the /24 of their origin)
It sounds like I’m on the right path, as I have been addressing the performance stuff based on your bullet point list below. I’m guessing it was stressing the server in the CPU/Memory department during brief moments. And it was also only when I was logged in, as I have caching disabled for logged in users. So it’s starting to make more sense.
Thank you for your detailed list, that helped to clear up a few things for me. Much appreciated!
 well, the good news is. I guess I should expect to get a lot less bullshit traffic on my site now. haha. I’m happy the Hestia team added in this check on the GUI. Otherwise I wouldn’t have known that I made this mistake.