Unexplained SSH Activity on Fresh Install

Hi everyone,

I recently installed HestiaCP (v1.9.2) on a fresh server (Linux Ubuntu Server 22.04 LTS) in my staging environment on Sunday afternoon (GMT timezone). Since then, I haven’t logged into it manually or configured anything.

  • No additional security measures have been applied yet (besides MFA for the control panel)
  • The server has no mail domains, no web domains, no databases, and no DNS configured yet
  • Only two users exist:
    • Admin user (with a custom name, different from “admin”).
    • My user (no services assigned).

:rotating_light: 
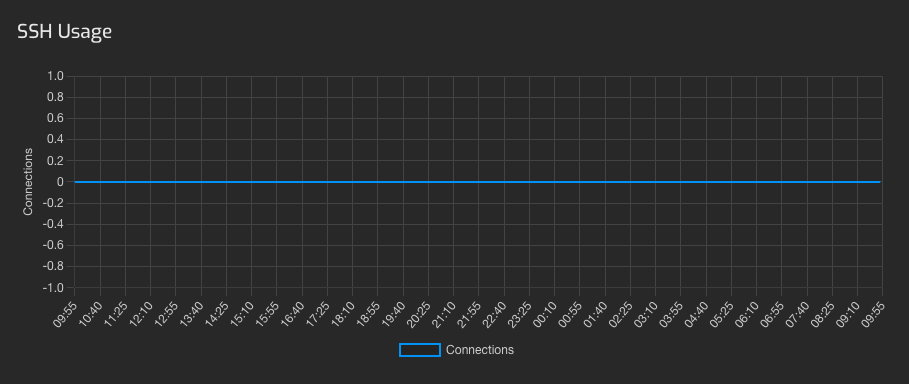
However, despite not accessing it, SSH connections have been logged, which I cannot explain (please refer to the below screenshot from the last 24 hours)


Findings from Troubleshooting:

1 - SSH Usage Graph shows activity over the last 24 Hours

2 - No unauthorized IPs detected

  • Checking /var/log/auth.log, all successful logins came from my public IP
  • No failed login attempts or brute-force attacks were detected.
  • Root SSH login is disabled

3 - Remote Desktop Manager (RDM) was running but Did NOT auto-reconnect

  • I use Devolutions Remote Desktop Manager to manage SSH connections
  • However, auto-reconnect is disabled, and RDM’s logs show no connection to myserver.example (this is not the real FQDN of my server)

4 - No Oracle Cloud agent activity

  • The server runs on Oracle Cloud, but journalctl showed no entries from the Oracle Cloud Agent at the time of the unexplained SSH session

5 - My Mac was online, but No SSH connections were made

  • My Mac was powered on at the time, but:
    • No SSH processes were running
    • No SSH commands were executed
    • No RDM logs recorded an SSH session
  • This confirms the session was not initiated from my machine!

6 - Checking Server Logs (journalctl) for Background Activity

  • Running:
sudo journalctl --since "2025-02-18 05:30" --until "2025-02-18 05:35"

did not reveal any clear system processes that might have initiated the SSH session.


Sanitized Logs

/var/log/auth.log – Successful SSH login (expected, but not initiated by me)

Feb 18 05:32:10 myserver sshd[1635]: Accepted publickey for myuser from xxx.xxx.xxx.xxx port 51550 ssh2: RSA SHA256:xxxxxxxxxxxxxxxxxxxx
Feb 18 05:32:10 myserver sshd[1635]: pam_unix(sshd:session): session opened for user myuser(uid=1001) by (uid=0)
  • My user logged in via public key authentication
  • I was NOT using my machine at that time
  • This suggests something initiated SSH without my interaction

ps aux | grep ssh on my Mac (no SSH sessions active)

myuser       7053   0.0  0.0 426845856   1648   ??  S     5:35am   0:00.03 /usr/bin/ssh-agent -l
  • The only SSH-related process was ssh-agent, which does not initiate connections.

netstat -tnp | grep ":22" on server (ongoing SSH connection at the time)

tcp        0     80 myserver:22            xxx.xxx.xxx.xxx:49984       ESTABLISHED 244692/sshd: myuser
  • SSH connection was active at that time, but I didn’t start it manually


Request for Help:

  • Could HestiaCP be running an automated task that establishes an SSH connection?
  • Has anyone else experienced unexplained SSH sessions on a fresh install?
  • Are there additional logs I should check to pinpoint what triggered this?

Any insights would be greatly appreciated! Thanks in advance.

Filemanger connects over sftp…

1 Like

Thanks for your response @eris but I don’t believe that’s the case.

1 - My staging environment had SSH activity, even though:

  • I hadn’t logged in since installing HestiaCP
  • File Manager was never opened
  • No users were active

2 - My production environment, where I actively use HestiaCP with multiple users and actual traffic, shows zero SSH activity (see the attached screenshot below):

3 - I checked all system logs (journalctl, auth.log, ps aux), and there is no evidence of HestiaCP initiating an SSH/SFTP session

If File Manager were automatically connecting over SSH/SFTP, I should see similar SSH activity in production—but I don’t.

Can you clarify under what conditions File Manager makes automated SSH connections, and where these would be logged? Because from my tests, this doesn’t seem to be the case.

The way Hestia checks the number of ssh connections is using this command:

ps auxf | grep sshd | grep -v grep | grep -v '/usr/sbin/' | wc -l

Maybe there are other processes with sshd in their name or arguments.

Hi @sahsanu, thanks for the explanation! However, this doesn’t fully explain the issue.

1 - I ran the command on both my Production and Staging environments:

  • Both returned the same result (2 processes).
  • Yet, Staging showed unexplained SSH activity while Production did not.

2 - If the HestiaCP SSH usage graph is based on ps auxf | grep sshd, it may be misleading:

  • The number of sshd processes doesn’t always correlate with actual SSH sessions.
  • A more reliable check is journalctl -u ssh | grep "session opened", which shows real login events.

3 - This suggests that HestiaCP might be misreporting SSH usage:

  • Can you confirm if the SSH usage graph is purely based on ps auxf | grep sshd?
  • If so, should this be improved to reflect actual session activity?

Last but not least:

  • The version of my instance of HestiaCP in Production is: v1.8.12
  • The version of my instance of HestiaCP in Staging is: v1.9.2

Thanks again for the insights!

We haven’t changed it in the last 3 years…

I checked my server and 1 of the server show zeros.

How ever both Ubuntu 24.04 has a lot of random connections…

Thanks for the clarification!

1 - Since HestiaCP’s SSH usage graph is based on ps aux | grep sshd, it seems like it doesn’t track real SSH logins, but just counts processes:

  • I’ve confirmed that both my Production and Staging servers return the same ps aux count
  • However, only Staging reports unexplained SSH activity while Production does not
  • This suggests the graph is not reliable for detecting real SSH usage

2 - The fact that Ubuntu 24.04 shows “random connections” makes me wonder if newer Ubuntu versions handle SSHD processes differently, leading to false readings:

  • My server is not running Ubuntu 24.04, but this might still be related

3 - Would it be possible to improve the SSH tracking mechanism to rely on actual login events instead?

  • Instead of counting ps aux | grep sshd, using journalctl -u ssh | grep "session opened" would provide a more accurate view of real SSH logins.

I appreciate your input—just trying to get to the bottom of this!

No it counts active SSH sessions it excludes the process /usr/sbin/sshd from the list

root@dev:~# ps auxf | grep sshd | grep -v grep | grep -v '/usr/sbin/' 
root     2571205  0.3  0.2  18000 11180 ?        Ss   11:30   0:00  \_ sshd: root@pts/0
root@dev:~# ps auxf | grep sshd | grep -v grep 
root     2353511  0.0  0.2  15436  9432 ?        Ss   Feb17   0:04 sshd: /usr/sbin/sshd -D [listener] 0 of 10-100 startups
root     2571205  0.2  0.2  18000 11180 ?        Ss   11:30   0:00  \_ sshd: root@pts/0
root@dev:~# ps auxf | grep sshd | grep -v grep  | wc -l

[quote=“ivano.buffa, post:7, topic:18130, full:true”]

  • I’ve confirmed that both my Production and Staging servers return the same ps aux count
  • However, only Staging reports unexplained SSH activity while Production does not
  • This suggests the graph is not reliable for detecting real SSH usage
    [/qoute]

It could be random connections from outside it doesn’t mean it is an active ssh connections. If bots try to connect to a server it will be also shown as active connections…

I do a lot more with those server and I haven’t blocked any external ssh connections so it might explain why…

[quote=“ivano.buffa, post:7, topic:18130, full:true”]
3 - Would it be possible to improve the SSH tracking mechanism to rely on actual login events instead?

  • Instead of counting ps aux | grep sshd, using journalctl -u ssh | grep "session opened" would provide a more accurate view of real SSH logins.

I appreciate your input—just trying to get to the bottom of this!

[/qoute]

Then we need to write an actual log praser to keep track of connection / disconnects to show the actual number. Is the investment of changing it worth it. It might be use to include an ssh log with last xx login attempt instead…

Hi @eris,

@eris: “No it counts active SSH sessions it excludes the process /usr/sbin/sshd from the list”

Thanks for confirming that HestiaCP only counts active SSH sessions.

However, this still doesn’t explain why:

  • My Staging environment (where I didn’t log in) showed unexplained SSH activity.
  • My Production environment (where I have actual users logging in) showed no SSH activity at all.
  • Both environments return the same ps aux count.

If it’s counting real sessions, why does it show activity in one environment but not the other?


@eris: “If bots try to connect to a server it will also be shown as active connections…”

If the SSH usage graph includes bot connections, shouldn’t I see failed logins in /var/log/auth.log?

  • I checked my logs, and there were zero failed SSH attempts.
  • If no failed logins occurred, how would bot activity be counted as an active session?
  • Can you clarify exactly what HestiaCP is detecting in these cases?

@eris: “Then we need to write an actual log parser to keep track of connections/disconnects… Is the investment worth it?”

I understand that rewriting the SSH tracking mechanism requires effort.
However, if the current system can mislead users into thinking there are active SSH sessions when there aren’t, wouldn’t it make sense to at least provide a more reliable way to track real SSH logins?

  • Would it be possible to include an option for users to choose between the current tracking method and one based on journalctl logins?
  • Even adding an SSH log summary (like you suggested) would improve clarity.

Thanks for your attention.

Regards.

Ivano Buffa

If it’s counting real sessions, why does it show activity in one environment but not the other?

It uses greps: all lines with sshd in the list
Then removes the line with grep
Then it removes the line with /usr/sbin/
And then counts the number of lines and nothing more…

  • I checked my logs, and there were zero failed SSH attempts.
  • If no failed logins occurred, how would bot activity be counted as an active session?
  • Can you clarify exactly what HestiaCP is detecting in these cases?

I have no idea only method is to find out Is to run the command and check

It doesn’t look it counts connections. The only thing we can do it to write a script that runs for a few hours and see. what it logs…

  • Would it be possible to include an option for users to choose between the current tracking method and one based on journalctl logins?

journalctl logins doesn’t show active connections so to show the active connections is “worthless”

Created a quick script:

#/bin/bash

log='/root/test_connections.txt';
a=$(ps auxf | grep sshd | grep -v grep | grep -v '/usr/sbin/' | wc -l)
if [ $a -ne 0 ]; then
  echo $(date -u) "Connections: $a" >> $log;
ps auxf | grep sshd | grep -v grep | grep -v '/usr/sbin/' >> $log;
fi

So it checks the number of sshd lines returns after the command if > 0 it logs ps aux content to a file…

Let see what happens over a few hours…

Thanks for the quick script and your insights @eris!

  1. I understand that HestiaCP tracks active SSH sessions based on the ps aux count. However, this method doesn’t clarify why Staging shows SSH activity but Production does not. Both servers show the same number of sshd processes, but only Staging reports unexplained SSH activity.

  2. The script you provided works for counting sshd processes, but I’m concerned it counts bot traffic or other background processes as active SSH sessions.

    • This could lead to false positives, especially when no actual user logged in.
  3. Regarding journalctl, while it doesn’t show active connections, it would give us the real login events, which would be more accurate than process counts.

  • I understand that we might not want to rely on it fully, but could we at least provide users with an option to track actual SSH logins alongside the current method?

Thanks again for the script and your suggestions!

Show the output of this command:

rrdtool info /usr/local/hestia/web/rrd/ssh/ssh.rrd

Login to your server via ssh and wait at least 5 minutes and the run this command:

rrdtool fetch /usr/local/hestia/web/rrd/ssh/ssh.rrd AVERAGE --start -2hour

Also show this:

v-list-cron-jobs admin
1 Like

Hi @sahsanu,

Thanks for your response! Here’s what I’ll do:

1 - I’ll run:

rrdtool info /usr/local/hestia/web/rrd/ssh/ssh.rrd

and provide the output.

2 - I’ll SSH into my server, wait for 5 minutes, then run:

rrdtool fetch /usr/local/hestia/web/rrd/ssh/ssh.rrd AVERAGE --start -2hour

to retrieve the latest recorded SSH activity.

3 - I’ll also check the cron jobs with:

v-list-cron-jobs admin

This will confirm whether the cron job responsible for updating SSH tracking is active.

I’ll report back with my findings. Thanks for looking into this!

Hi @sahsanu,

As per my last comment.

Production (v1.8.12):

# rrdtool info /usr/local/hestia/web/rrd/ssh/ssh.rrd
filename = "/usr/local/hestia/web/rrd/ssh/ssh.rrd"
rrd_version = "0003"
step = 300
last_update = 1740296102
header_size = 2040
ds[A].index = 0
ds[A].type = "GAUGE"
ds[A].minimal_heartbeat = 600
ds[A].min = NaN
ds[A].max = NaN
ds[A].last_ds = "2"
ds[A].value = 4.2418120000e+00
ds[A].unknown_sec = 0
rra[0].cf = "AVERAGE"
rra[0].rows = 600
rra[0].cur_row = 571
rra[0].pdp_per_row = 1
rra[0].xff = 5.0000000000e-01
rra[0].cdp_prep[0].value = NaN
rra[0].cdp_prep[0].unknown_datapoints = 0
rra[1].cf = "AVERAGE"
rra[1].rows = 700
rra[1].cur_row = 637
rra[1].pdp_per_row = 6
rra[1].xff = 5.0000000000e-01
rra[1].cdp_prep[0].value = 1.9862888267e+00
rra[1].cdp_prep[0].unknown_datapoints = 0
rra[2].cf = "AVERAGE"
rra[2].rows = 775
rra[2].cur_row = 355
rra[2].pdp_per_row = 24
rra[2].xff = 5.0000000000e-01
rra[2].cdp_prep[0].value = 1.9862888267e+00
rra[2].cdp_prep[0].unknown_datapoints = 0
rra[3].cf = "AVERAGE"
rra[3].rows = 797
rra[3].cur_row = 110
rra[3].pdp_per_row = 288
rra[3].xff = 5.0000000000e-01
rra[3].cdp_prep[0].value = 1.9862888267e+00
rra[3].cdp_prep[0].unknown_datapoints = 0
rra[4].cf = "MAX"
rra[4].rows = 600
rra[4].cur_row = 167
rra[4].pdp_per_row = 1
rra[4].xff = 5.0000000000e-01
rra[4].cdp_prep[0].value = NaN
rra[4].cdp_prep[0].unknown_datapoints = 0
rra[5].cf = "MAX"
rra[5].rows = 700
rra[5].cur_row = 85
rra[5].pdp_per_row = 6
rra[5].xff = 5.0000000000e-01
rra[5].cdp_prep[0].value = 1.9862888267e+00
rra[5].cdp_prep[0].unknown_datapoints = 0
rra[6].cf = "MAX"
rra[6].rows = 775
rra[6].cur_row = 478
rra[6].pdp_per_row = 24
rra[6].xff = 5.0000000000e-01
rra[6].cdp_prep[0].value = 1.9862888267e+00
rra[6].cdp_prep[0].unknown_datapoints = 0
rra[7].cf = "MAX"
rra[7].rows = 797
rra[7].cur_row = 107
rra[7].pdp_per_row = 288
rra[7].xff = 5.0000000000e-01
rra[7].cdp_prep[0].value = 1.9862888267e+00
rra[7].cdp_prep[0].unknown_datapoints = 0

# rrdtool fetch /usr/local/hestia/web/rrd/ssh/ssh.rrd AVERAGE --start -2hour
                              A

1740289500: 0.0000000000e+00
1740289800: 0.0000000000e+00
1740290100: 0.0000000000e+00
1740290400: 0.0000000000e+00
1740290700: 0.0000000000e+00
1740291000: 0.0000000000e+00
1740291300: 0.0000000000e+00
1740291600: 0.0000000000e+00
1740291900: 0.0000000000e+00
1740292200: 0.0000000000e+00
1740292500: 0.0000000000e+00
1740292800: 0.0000000000e+00
1740293100: 0.0000000000e+00
1740293400: 0.0000000000e+00
1740293700: 0.0000000000e+00
1740294000: 0.0000000000e+00
1740294300: 0.0000000000e+00
1740294600: 0.0000000000e+00
1740294900: 0.0000000000e+00
1740295200: 0.0000000000e+00
1740295500: 0.0000000000e+00
1740295800: 0.0000000000e+00
1740296100: 1.9862888267e+00
1740296400: 2.0000000000e+00
1740296700: nan

# v-list-cron-jobs admin
JOB  MIN  HOUR  MONTH  WDAY  COMMAND
---  ---  ----  -----  ----  -------
1    */2  *     *      *     sudo /usr/local/hestia/bin/v-update-sys-queue restart
2    10   00    *      *     sudo /usr/local/hestia/bin/v-update-sys-queue daily
3    15   02    *      *     sudo /usr/local/hestia/bin/v-update-sys-queue disk
4    10   00    *      *     sudo /usr/local/hestia/bin/v-update-sys-queue traffic
5    30   03    *      *     sudo /usr/local/hestia/bin/v-update-sys-queue webstats
6    */5  *     *      *     sudo /usr/local/hestia/bin/v-update-sys-queue backup
7    10   05    *      *     sudo /usr/local/hestia/bin/v-backup-users
8    20   00    *      *     sudo /usr/local/hestia/bin/v-update-user-stats
9    */5  *     *      *     sudo /usr/local/hestia/bin/v-update-sys-rrd
10   21   3     *      *     sudo /usr/local/hestia/bin/v-update-letsencrypt-ssl
11   55   23    *      *     sudo apt autoremove -y

Staging (v1.9.2):

# rrdtool info /usr/local/hestia/web/rrd/ssh/ssh.rrd
filename = "/usr/local/hestia/web/rrd/ssh/ssh.rrd"
rrd_version = "0003"
step = 300
last_update = 1740296102
header_size = 2040
ds[A].index = 0
ds[A].type = "GAUGE"
ds[A].minimal_heartbeat = 600
ds[A].min = NaN
ds[A].max = NaN
ds[A].last_ds = "2"
ds[A].value = 4.0841340000e+00
ds[A].unknown_sec = 0
rra[0].cf = "AVERAGE"
rra[0].rows = 600
rra[0].cur_row = 154
rra[0].pdp_per_row = 1
rra[0].xff = 5.0000000000e-01
rra[0].cdp_prep[0].value = NaN
rra[0].cdp_prep[0].unknown_datapoints = 0
rra[1].cf = "AVERAGE"
rra[1].rows = 700
rra[1].cur_row = 130
rra[1].pdp_per_row = 6
rra[1].xff = 5.0000000000e-01
rra[1].cdp_prep[0].value = 1.9872279400e+00
rra[1].cdp_prep[0].unknown_datapoints = 0
rra[2].cf = "AVERAGE"
rra[2].rows = 775
rra[2].cur_row = 745
rra[2].pdp_per_row = 24
rra[2].xff = 5.0000000000e-01
rra[2].cdp_prep[0].value = 1.9872279400e+00
rra[2].cdp_prep[0].unknown_datapoints = 0
rra[3].cf = "AVERAGE"
rra[3].rows = 797
rra[3].cur_row = 219
rra[3].pdp_per_row = 288
rra[3].xff = 5.0000000000e-01
rra[3].cdp_prep[0].value = 1.9872279400e+00
rra[3].cdp_prep[0].unknown_datapoints = 0
rra[4].cf = "MAX"
rra[4].rows = 600
rra[4].cur_row = 395
rra[4].pdp_per_row = 1
rra[4].xff = 5.0000000000e-01
rra[4].cdp_prep[0].value = NaN
rra[4].cdp_prep[0].unknown_datapoints = 0
rra[5].cf = "MAX"
rra[5].rows = 700
rra[5].cur_row = 380
rra[5].pdp_per_row = 6
rra[5].xff = 5.0000000000e-01
rra[5].cdp_prep[0].value = 1.9872279400e+00
rra[5].cdp_prep[0].unknown_datapoints = 0
rra[6].cf = "MAX"
rra[6].rows = 775
rra[6].cur_row = 164
rra[6].pdp_per_row = 24
rra[6].xff = 5.0000000000e-01
rra[6].cdp_prep[0].value = 1.9872279400e+00
rra[6].cdp_prep[0].unknown_datapoints = 0
rra[7].cf = "MAX"
rra[7].rows = 797
rra[7].cur_row = 775
rra[7].pdp_per_row = 288
rra[7].xff = 5.0000000000e-01
rra[7].cdp_prep[0].value = 1.9872279400e+00
rra[7].cdp_prep[0].unknown_datapoints = 0

# rrdtool fetch /usr/local/hestia/web/rrd/ssh/ssh.rrd AVERAGE --start -2hour
                              A

1740289500: 0.0000000000e+00
1740289800: 0.0000000000e+00
1740290100: 0.0000000000e+00
1740290400: 0.0000000000e+00
1740290700: 0.0000000000e+00
1740291000: 0.0000000000e+00
1740291300: 0.0000000000e+00
1740291600: 0.0000000000e+00
1740291900: 0.0000000000e+00
1740292200: 0.0000000000e+00
1740292500: 0.0000000000e+00
1740292800: 0.0000000000e+00
1740293100: 0.0000000000e+00
1740293400: 0.0000000000e+00
1740293700: 0.0000000000e+00
1740294000: 0.0000000000e+00
1740294300: 0.0000000000e+00
1740294600: 0.0000000000e+00
1740294900: 0.0000000000e+00
1740295200: 0.0000000000e+00
1740295500: 0.0000000000e+00
1740295800: 0.0000000000e+00
1740296100: 1.9872279400e+00
1740296400: 2.0000000000e+00
1740296700: nan

As Staging is running on v1.9.2 and given this post, the output of v-list-cron-jobs admin is empty. Anyhow, this is the list of allk cronjobs in staging:

*/2 * * * * sudo /usr/local/hestia/bin/v-update-sys-queue restart
10 00 * * * sudo /usr/local/hestia/bin/v-update-sys-queue daily
15 02 * * * sudo /usr/local/hestia/bin/v-update-sys-queue disk
10 00 * * * sudo /usr/local/hestia/bin/v-update-sys-queue traffic
30 03 * * * sudo /usr/local/hestia/bin/v-update-sys-queue webstats
*/5 * * * * sudo /usr/local/hestia/bin/v-update-sys-queue backup
10 05 * * * sudo /usr/local/hestia/bin/v-backup-users
20 00 * * * sudo /usr/local/hestia/bin/v-update-user-stats
*/5 * * * * sudo /usr/local/hestia/bin/v-update-sys-rrd
12 7 * * * sudo /usr/local/hestia/bin/v-update-letsencrypt-ssl

As you can see these are the default ones as this is a fresh deployment.

I was only trying to debug your production environment.

All looks fine, also rrdtool is updating the db with active ssh connections:

1740296100: 1.9862888267e+00
1740296400: 2.0000000000e+00

You can copy /usr/local/hestia/web/rrd/ssh/daily-ssh.png to one of your web domains (or your PC) and try to open it just to check whether the graph is updated.

1 Like

I secured SSH access by:

  • Restricting SSH access from a specific public IP address only
  • Changing default SSH
  • Enabling SSH access only via Port Knocking technique