gamage
June 14, 2026, 7:48am
1
I have Moldova VPS, 4GB Ram, 40GB SSD, 2 Core CPU,
Debian 12, HestiaCP, Php8.3 nginx
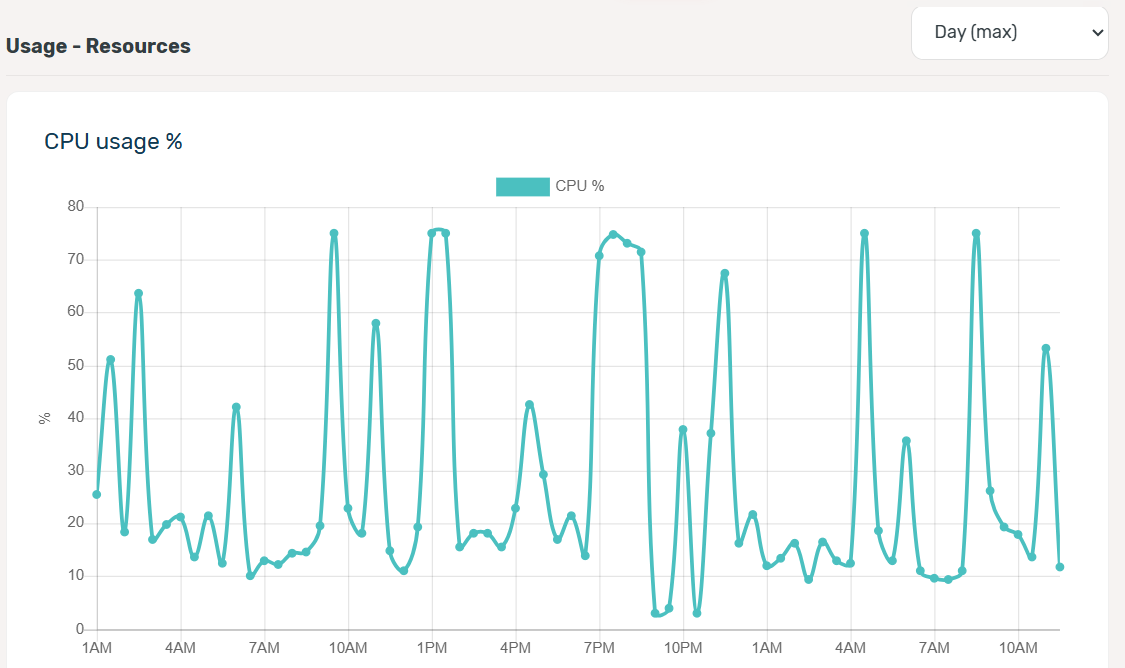
My VPS and all service up but every 1/2 minutes website down, Cloudflare error 521
i installed VPS with Claude AI, All configuration done with AI, But website always down, show alers, even i work on site down every 2/3 minuts, down keep 1/2 minutes then Up again, this happen 24hrs.
Im trying fix 2 weeks, still fail, can anyone tell me how to fix and where should i change and fix
Show the output of these commands (one by one):
curl -fsSLm15 https://7j.gg/hcpver | bash
uptime
df -h
free -h
systemctl status nginx --no-pager -l
cat /proc/"$(ps -ef | grep -E '[n]ginx -c' | awk '{print $2}')"/limits
tail -n30 /var/log/nginx/error.log
dmesg | grep -Ei "oom|killed process" | tail -20
Show also this output:
curl -fsSLm15 https://7j.gg/chknof | bash
gamage
June 14, 2026, 9:33am
4
here is results, this is big problem for me, working 2 weeks, no solution . if you can help appreciate
root@cp:~# curl -fsSLm15 https://7j.gg/hcpver | bash
Software Version
OS Debian 12.14
Hestia 1.9.6
Hestia-nginx 1.30.2
Hestia-php 8.4.21
FileGator 7.14.3
Nginx 1.31.1
PHP8.3 8.3.31
Awstats 7.8
Exim4 4.96
Dovecot 2.3.19.1
Roundcube 1.6.16
Bind9 9.18.49
Mariadb 10.11.14
phpMyAdmin 5.2.3
Fail2ban 1.0.2
root@cp:~#
root@cp:~# uptime
09:24:58 up 1 day, 23:54, 1 user, load average: 0.50, 0.37, 0.23
root@cp:~#
root@cp:~# df -h
Filesystem Size Used Avail Use% Mounted on
udev 1.9G 0 1.9G 0% /dev
tmpfs 392M 608K 391M 1% /run
/dev/sda1 40G 11G 27G 29% /
tmpfs 2.0G 0 2.0G 0% /dev/shm
tmpfs 5.0M 0 5.0M 0% /run/lock
/dev/sda15 124M 12M 113M 10% /boot/efi
tmpfs 392M 0 392M 0% /run/user/0
root@cp:~#
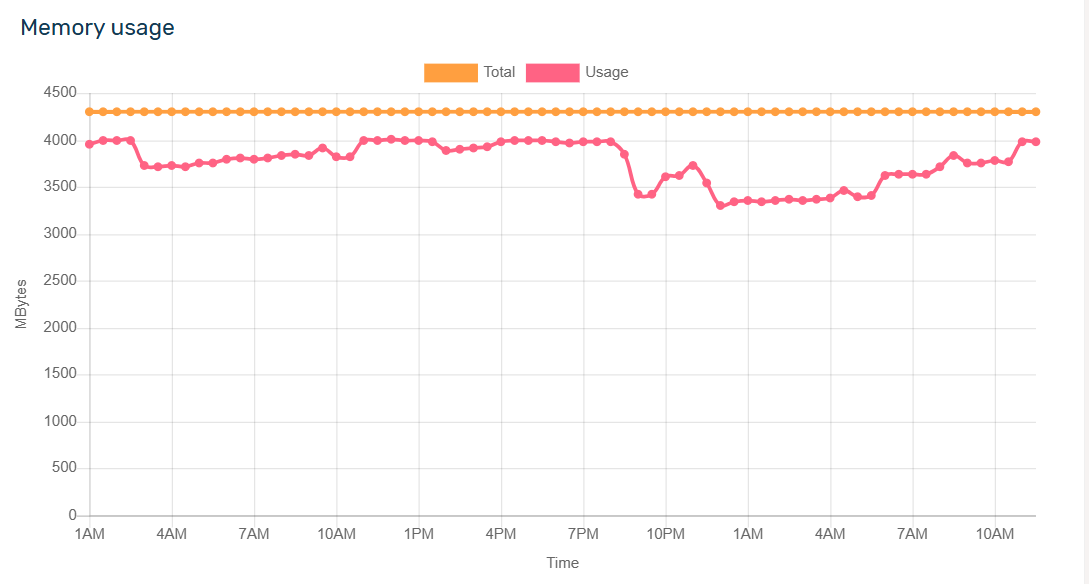
root@cp:~# free -h
total used free shared buff/cache available
Mem: 3.8Gi 1.3Gi 203Mi 264Mi 2.8Gi 2.5Gi
Swap: 2.0Gi 237Mi 1.8Gi
root@cp:~#
root@cp:~# systemctl status nginx --no-pager -l
● nginx.service - nginx - high performance web server
Loaded: loaded (/lib/systemd/system/nginx.service; enabled; preset: enabled)
Active: active (running) since Fri 2026-06-12 09:30:33 UTC; 1 day 23h ago
Docs:
Process: 495 ExecStart=/usr/sbin/nginx -c ${CONFFILE} (code=exited, status=0/SUCCESS)
Process: 527014 ExecReload=/bin/sh -c /bin/kill -s HUP $(/bin/cat /run/nginx.pid) (code=exited, status=0/SUCCESS)
Main PID: 539 (nginx)
Tasks: 4 (limit: 4651)
Memory: 66.7M
CPU: 8min 46.474s
CGroup: /system.slice/nginx.service
├─ 539 “nginx: master process /usr/sbin/nginx -c /etc/nginx/nginx.conf”
├─527062 “nginx: worker process”
├─527063 “nginx: worker process”
└─527064 “nginx: cache manager process”
Jun 12 10:03:21 cp.domain.com systemd[1]: Reloading nginx.service - nginx - high performance web server…
Jun 12 10:03:21 cp.domain.com systemd[1]: Reloaded nginx.service - nginx - high performance web server.
Jun 13 05:53:02 cp.domain.com systemd[1]: Reloading nginx.service - nginx - high performance web server…
Jun 13 05:53:02 cp.domain.com systemd[1]: Reloaded nginx.service - nginx - high performance web server.
Jun 13 19:19:16 cp.domain.com systemd[1]: Reloading nginx.service - nginx - high performance web server…
Jun 13 19:19:16 cp.domain.com systemd[1]: Reloaded nginx.service - nginx - high performance web server.
Jun 13 20:15:13 cp.domain.com systemd[1]: Reloading nginx.service - nginx - high performance web server…
Jun 13 20:15:13 cp.domain.com systemd[1]: Reloaded nginx.service - nginx - high performance web server.
Jun 14 05:53:02 cp.domain.com systemd[1]: Reloading nginx.service - nginx - high performance web server…
Jun 14 05:53:02 cp.domain.com systemd[1]: Reloaded nginx.service - nginx - high performance web server.
root@cp:~#
Jun 14 05:53:02 cp.domain.com systemd[1]: Reloaded nginx.service - nginx - high performacat /proc/“$(ps -ef | grep -E ‘[n]ginx -c’ | awk ‘{print $2}’)”/limits cat /proc/“$(ps -ef | grep -E ‘[n]ginx -c’ | awk ‘{print $2}’)”/limits
Limit Soft Limit Hard Limit Units
Max cpu time unlimited unlimited seconds
Max file size unlimited unlimited bytes
Max data size unlimited unlimited bytes
Max stack size 8388608 unlimited bytes
Max core file size 0 unlimited bytes
Max resident set unlimited unlimited bytes
Max processes 15503 15503 processes
Max open files 1024 524288 files
Max locked memory 8388608 8388608 bytes
Max address space unlimited unlimited bytes
Max file locks unlimited unlimited locks
Max pending signals 15503 15503 signals
Max msgqueue size 819200 819200 bytes
Max nice priority 0 0
Max realtime priority 0 0
Max realtime timeout unlimited unlimited us
root@cp:~#
root@cp:~# tail -n30 /var/log/nginx/error.log
root@cp:~#
root@cp:~# dmesg | grep -Ei “oom|killed process” | tail -20
root@cp:~#
root@cp:~# curl -fsSLm15 https://7j.gg/chknof | bash
root@cp:~#
All looks good but you should raise the number of files limit for nginx (execute these commands as root).
mkdir -p /etc/systemd/system/nginx.service.d
echo -e "[Service]\nLimitNOFILE=65535" > /etc/systemd/system/nginx.service.d/override.conf
systemctl daemon-reload
systemctl restart nginx
The last command didn’t show any output?
curl -fsSLm15 https://7j.gg/chknof | bash
If you disable Cloudflare proxy for your domain, do you have the same issue?
gamage
June 14, 2026, 10:14am
6
Your script timeout then claude give script run as follows, its give following results.
root@cp:~# bash << ‘EOF’
pct=80
services=“nginx”
pids=“$(pidof $services)”
if [[ -z $pids ]]; then
echo “No pids found for $services”
exit 1
fi
echo “Checking service: nginx”
echo “Open files limit threshold: ${pct}%”
echo “”
for i in $pids; do
pname=“$(ps -ef | grep -E “^\S+\s+$i\s” | awk ‘{print $8}’)”
pcount=“$(lsof -p “$i” 2>/dev/null | wc -l)”
lcount=“$(grep ‘Max open files’ /proc/$i/limits | awk ‘{print $4}’)”
percent=“$((lcount * pct / 100))”
echo “PID $i :: $pname”
echo "  Open files:  $pcount"
echo "  Limit:       $lcount"
echo "  80% of limit: $percent"
if [[ $pcount -ge $percent ]]; then
echo "  STATUS: WARNING - approaching limit!"
else
echo "  STATUS: OK"
EOFeecho “”
Checking service: nginx
Open files limit threshold: 80%

PID 614675 :: nginx:
Open files:  48
Limit:       65535
80% of limit: 52428
STATUS: OK

PID 614674 :: nginx:
Open files:  51
Limit:       65535
80% of limit: 52428
STATUS: OK

PID 614673 :: nginx:
Open files:  59
Limit:       65535
80% of limit: 52428
STATUS: OK

PID 614672 :: nginx:
Open files:  50
Limit:       65535
80% of limit: 52428
STATUS: OK

root@cp:~#
even now website show error on cloudflare, but after minutes it back to normal. repeated.
i turned off cloudflare. didnt removed, wait and see whats happen.
i turned off cloudflare,
gamage
June 14, 2026, 10:23am
7
claude put 2 script to server monitor and keep cpu ram up when hike, is that ok
Services running 24/7:
vps-autorecovery — auto-restarts PHP-FPM/Nginx when CPU/RAM spikes
vps_monitor.sh — logs all server stats every 30 seconds
php8.3-fpm — 15 persistent workers across 4 sites
nginx — with 65535 file limit + FastCGI cache enabled
What auto-recovery does automatically:
CPU > 85% → kills zombie PHP workers, restarts PHP-FPM
RAM > 88% → drops caches, kills oversized workers
PHP-FPM workers < 8 → restarts PHP-FPM + reloads Nginx
Sites returning non-200 → attempts full service recovery
Check recovery logs anytime:
bash
bash /root/vps_autorecovery.sh logs
Check recovery status:
bash
bash /root/vps_autorecovery.sh status
gamage
June 14, 2026, 10:53am
8
this setting changed
Nginx connections from 1,024 to 8,192
4 wp sites, now sites loead, but need check 24hrs
gamage
June 14, 2026, 3:39pm
9
web sites and Cpannel still down as early. i don’t know reason.
only 10 minutes were up after my last configuration
One thing is that they are down or not running, and another is that they are not accessible via their public IP address.
Could you please share the domain name and public IP address? You can send it to me in a private message.
Show the output of this command:
iptables -S
gamage
June 14, 2026, 4:52pm
11
i can’t find way to private message, i searched lot, on profile and my profile, can’t find private message option, my account 1 day old,
can you msg me, i can share my sever details