Websites are very slow

Hello,
i come from CloudPanel to HestiaCP sine few days.
In HestiaCP, i’ve 40 subdomains as reverse proxy, and 6 wordpress and static html websites.
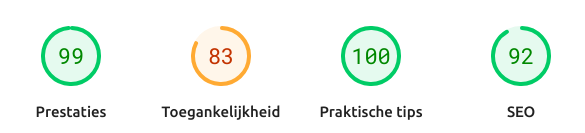
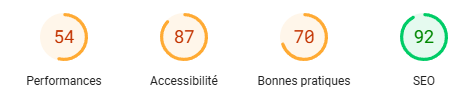
Reverse proxy have a great speed loading, but wordpress websites are very slow, as you can see with Google PageSpeed.
Wordpress website
image
Static website
image

I’ve already enabled “caching” on NGinx template, but he have any effect on my speed loading.

My HestiaCP server is on Proxmox VM with 4 vCPU and 8GB of RAM.
Thanks a lot for your further answers and hope you have a good day :slight_smile:

I have also noticed that page generation speed on HestiaCP is slower than on other panels.

I was looking at CloudPanel and Fastpanel and have dome some comparisons.

Using the same virtual machine running Debian 12.7 with 4 vCPU, 4GB RAM and a clean install of each panel I have done a comparison of page generation time between the different panels. CloudPanel and Fastpanel performed roughly the same so I’ll only include CloudPanel results below.

All these page speeds were recorded in the WordPress query monitor plugin after refreshing the WordPress dashboard three times on a copy of a production ecommerce website with around 50 plugins.

Redis cache was enabled on both panels but all other caches are turned off

HestiaCP - Nginx only, PHP-FPM - PHP8.2, MariaDB
Page Generation Time: 2.73s
Database Queries: 0.01s

Using WordPress template

CloudPanel - Nginx only, PHP-FPM - PHP-8.2, MariaDB
Page Generation Time: 1.08s
Database Queries: 0.17s

I’ve since tweaked CloudPanels MariaDB config to be the same as HestiaCP and reduced the database query time down to 0.01s.

Anyone got any ideas what is causing HestiaCP to take 2.5x as long to generate the pages? Database performance is great in Hestia, better than CloudPanel out of the box so I think we can rule that out?

I can’t tell if it’s a PHP-FPM, PHP or Nginx configuration issue but it would be great to get Hestias page generation performance to match CloudPanel.

I guess it is all about your wordpress setup, the wordpress plugins you use and the quality of your hosting provider.
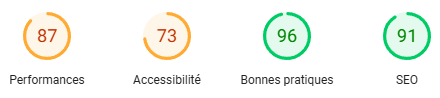
See below for a wordpress site on hestia (apache+nginx) with a few wordpress plugins, no cloudflare or other cdn, no optimisation yet:


So, I don’t think you can blame hestia

I only have jetpack plugin and magazine theme.
I’m my own provider and with cloud panel all work great.
Idk why in hestiacp my website is very slow, but it’s not my WordPress install.

This is unlikely to be related to Hestia; in essence, the panel itself is a set of tools. My sites are incredibly fast, the scale is not enough) https://pagespeed.web.dev/analysis/https-quantumtransition-angellive-ru/pk8ofumege?form_factor=mobile. Optimization, the right theme, Quic, etc. give a speed advantage. Again, update MariaBD to 11.4 and you will see an even more noticeable difference, it’s like a constructor, build what you want)

That’s ignoring the fact that the same site on the same server using Cloudpanel or Fastpanel loads pages up to 60% faster in tests I’ve done.

This will be much less noticeable on smaller sites.

My point is that their must be a configuration in Hestia that impacts performance. Whether this is just an issue with the WordPress profile or a wider issue I don’t know.

Send your website address here and we’ll take a look. And yet, CF is not an indicator of speed; on the contrary, it often slows down. So in Fastpanel everything is a little different, although in general it seems, I’m sure it’s not the panels, but rather their customization for certain sites

Hello I meet the same situation, (without benchmark) managing the same website on cloudpanel and hestiacp , I notice that heavy pages are twice slower on hestiacp.

I don’t find why, looking in logs and monitoring metrics. I have few visitors only and neutralizing bots, so the trafic is not the bottleneck, neither the server capability (4cpu 4go ram, never reach half capacity).

I came to hestiacp because of the apache2 support.

My configuration is currently a 1 heavy site with 50 plugins and only authorized users. with redis opcache, acpu , php 8.5, mysql8. I plan to add 5 same sites.

I guess this is something about php/mysql fine settings.
I notice that hestiacp own 3 mysql install profile depending on the server ram but i used the right one (my-large.conf).
I tried to tweak php.ini and my.cnf.

I would compare the nginx setup on the two machines if you have the old machine’s configuration backed up, if not I would do another cloudpanel install and compare them:

/etc/nginx/nginx.conf

/etc/nginx/sites-enabled/site

On one of my cloudpanel’s it has a LOT in nginx.conf:

user root;
worker_processes auto;
pid /run/nginx.pid;
worker_rlimit_nofile 8192;
include /etc/nginx/modules-enabled/*.conf;

events {
worker_connections 2000;
# multi_accept on;
}

http {

##
# Basic Settings
##

geoip_country /etc/nginx/geoip/GeoIP.dat; # the country IP database
geoip_city    /etc/nginx/geoip/GeoLiteCity.dat; # the city IP database

real_ip_recursive on;

set_real_ip_from 127.0.0.1;
set_real_ip_from 10.0.0.0/8;
set_real_ip_from 172.16.0.0/12;
set_real_ip_from 192.168.0.0/16;
set_real_ip_from 0.0.0.0/0;
#real_ip_header X-Forwarded-For;

log_format main '$remote_addr - $remote_user [$time_local] "$request" '
                '$status $body_bytes_sent "$http_referer" '
                '"$http_user_agent" "$http_x_forwarded_for"';

log_format cloudflare '$http_cf_connecting_ip - $remote_user [$time_local] "$request" '
                      '$status $body_bytes_sent "$http_referer" '
                      '"$http_user_agent" "$http_x_forwarded_for"';

sendfile on;
tcp_nopush on;
tcp_nodelay on;

client_body_buffer_size  1K;
client_header_buffer_size 1k;
client_max_body_size 64M;
keepalive_timeout 65;
types_hash_max_size 2048;
server_names_hash_bucket_size 128;
server_tokens off;
port_in_redirect off;
access_log off;
disable_symlinks if_not_owner from=/home/;

map $scheme $fastcgi_https { ## Detect when HTTPS is used
  default off;
  https on;
}

include /etc/nginx/blocked_ips;

pagespeed off;
pagespeed XHeaderValue 1;

##
# SSL Settings
##

ssl_protocols TLSv1.2 TLSv1.3;
ssl_session_cache builtin:1000 shared:SSL:10m;
ssl_session_timeout 10m;
ssl_ciphers EECDH+AESGCM:EDH+AESGCM;
ssl_prefer_server_ciphers on;
ssl_conf_command Options KTLS;
#    ssl_stapling on;
#    ssl_stapling_verify on;
ssl_dhparam /etc/nginx/ssl/dhparams.pem;

include /etc/nginx/mime.types;
default_type application/octet-stream;

##
# Logging Settings
##

access_log /var/log/nginx/access.log;
error_log /var/log/nginx/error.log;

##
# Limit the requests for php
##

limit_req_zone $binary_remote_addr zone=limit:10m rate=1r/s;

##
# Gzip Settings
##

gzip on;
gzip_disable "msie6";
gzip_vary on;
gzip_proxied any;
gzip_comp_level 8;
gzip_buffers 16 8k;
gzip_http_version 1.1;
gzip_types text/plain text/css application/json application/x-javascript text/xml application/xml application/xml+rss text/javascript image/png image/gif image/jpeg application/javascript image/svg+xml;

##
# Brotli Settings
##

brotli on;
brotli_comp_level 8;
brotli_static on;
brotli_types text/plain text/css application/json application/x-javascript text/xml application/xml application/xml+rss text/javascript image/png image/gif image/jpeg application/javascript image/svg+xm

l;

##
# Virtual Host Configs
##
# Declare if request came from a trusted network (WAF).
# Added by Sucuri/GoDaddy WAF team.
#    geo $realip_remote_addr $untrusted {
#        default 1;
#        127.0.0.1 0;
#        192.88.134.0/23 0;
#        185.93.228.0/22 0;
#        66.248.200.0/22 0;
#        208.109.0.0/22 0;
#        2a02:fe80::/29 0;
#    }

include /etc/nginx/sites-enabled/*.conf;

}

In one of the sites, domain name changed, can see:

server {
listen 80;
listen [::]:80;
listen 443 quic;
listen 443 ssl;
listen [::]:443 quic;
listen [::]:443 ssl;
http2 on;
http3 off;
ssl_certificate_key /etc/nginx/ssl-certificates/abc.org.key;
ssl_certificate /etc/nginx/ssl-certificates/abc.org.crt;
server_name www.abc.org;
return 301 https://abc.org$request_uri;
if ($http_x_sucuri_clientip = “”) {
return 403;
}
if ($http_x_sucuri_country = “”) {
return 403;
}
}

server {
listen 80;
listen [::]:80;
listen 443 quic;
listen 443 ssl;
listen [::]:443 quic;
listen [::]:443 ssl;
http2 on;
http3 off;
ssl_certificate_key /etc/nginx/ssl-certificates/abc.org.key;
ssl_certificate /etc/nginx/ssl-certificates/abc.org.crt;
server_name abc.org www1.abc.org;
root /home/abc/htdocs/abc.org;

access_log /home/abc/logs/nginx/access.log main;
error_log /home/abc/logs/nginx/error.log;

if ($scheme != “https”) {
rewrite ^ https://$host$request_uri permanent;
}

location ~ /.well-known {
auth_basic off;
allow all;
}

location / {

# Access control

allow 192.88.134.0/23;

allow 185.93.228.0/22;

allow 2a02:fe80::/29;

allow 66.248.200.0/22;

allow 208.109.0.0/22;

deny all;

proxy_pass http://127.0.0.1:8080;
proxy_set_header Host $host;
proxy_set_header X-Forwarded-Host $host;
proxy_set_header X-Real-IP $remote_addr;
proxy_set_header X-Forwarded-For $proxy_add_x_forwarded_for;
proxy_hide_header X-Varnish;
proxy_redirect off;
proxy_max_temp_file_size 0;
proxy_connect_timeout      720;
proxy_send_timeout         720;
proxy_read_timeout         720;
proxy_buffer_size          128k;
proxy_buffers              4 256k;
proxy_busy_buffers_size    256k;
proxy_temp_file_write_size 256k;

}

location ~* ^.+.(css|js|jpg|jpeg|gif|png|ico|gz|svg|svgz|ttf|otf|woff|woff2|eot|mp4|ogg|ogv|webm|webp|zip|swf|map|mjs)$ {
add_header Access-Control-Allow-Origin “*”;
add_header alt-svc ‘h3=“:443”; ma=86400’;
expires max;
access_log off;
}

location ~ /.(ht|svn|git) {
deny all;
}

if (-f $request_filename) {
break;
}
if ($http_x_sucuri_clientip = “”) {
return 403;
}
if ($http_x_sucuri_country = “”) {
return 403;
}
}

server {
listen 8080;
listen [::]:8080;
server_name abc.org www1.abc.org;
root /home/abc/htdocs/abc.org;

include /etc/nginx/global_settings;

try_files $uri $uri/ /index.php?$args;
index index.php index.html;

location ~ .php$ {
include fastcgi_params;
fastcgi_intercept_errors on;
fastcgi_index index.php;
fastcgi_param SCRIPT_FILENAME $document_root$fastcgi_script_name;
try_files $uri =404;
fastcgi_read_timeout 3600;
fastcgi_send_timeout 3600;
fastcgi_param HTTPS “on”;
fastcgi_param SERVER_PORT 443;
fastcgi_pass 127.0.0.1:14001;
fastcgi_param PHP_VALUE "
error_log=/home/abc/logs/php/error.log;
memory_limit=512M;
max_execution_time=300;
max_input_time=300;
max_input_vars=10000;
post_max_size=256M;
upload_max_filesize=128M;
date.timezone=UTC;
display_errors=off;";
if ($http_x_sucuri_clientip = “”) {
return 403;
}
if ($http_x_sucuri_country = “”) {
return 403;
}
}

if (-f $request_filename) {
break;
}
}

This might help.
Oh wow, seems like quite a task to compare them, perhaps I will get around to it one of these days. Perhaps some admin here already has, please comment!
Hello,

Yes i guess comparing them on every point may completed the gap on the difference between both hestiacp and cloudpanel. As you said : it’s a big task.

I would not spend time on nginx conf : I can tell hestiacp is slower on request duration from apache/nginx access logs.
But this is for heavy page and I can tell (comparing mysql log especially the few slow queries) that the same mysql query is significally slower en hestiacp. → mysql conf may be my first track.

Unfortunally there are many parameters in mysql conf (including innodb_* variables !).

Note that redis as been tweak to on cloudpanel (not the default conf) : that may be an other reason.

Seems that “slower hestiacp” only concerns sites with much calculation and heavy database queries. Much hestiacp users won’t meet this issue, even with many sites on hestiacp.

I think there may be a small point worth clarifying: HestiaCP and CloudPanel are primarily hosting control panels. They provide an interface to manage the underlying services, but the actual OS-level services and their configuration can usually be tuned independently depending on the specific setup.

Also, when migrating a complete website or a specific application such as WordPress between different hosting control panels, it is worth checking whether there are any configuration differences that could affect the migrated site. For example, different panels may use different paths or service configurations, so I would check both the website files and database for any remaining references to the previous environment.

It would also be useful to check the website error logs and relevant system/service logs before concluding that the control panel itself is responsible for the performance difference. Server specifications and the hosting provider can also have a significant impact. If the two servers are hosted by different providers, running some basic benchmarks could help establish whether the underlying systems are performing similarly.

Another important point is whether the service stacks are actually equivalent. For example, I don’t have enough experience with your particular CloudPanel setup to say what it is using, but one server might be running Apache + Redis while the other uses Nginx + Apache + Memcached, or simply different versions/configurations of the same services. In that situation, it would be difficult to make a direct performance comparison because the two environments are not really equivalent. The OS versions and their configurations could also make a difference.

So, in general, I would see the control panel mainly as an interface for managing the underlying services. The panel itself does not necessarily interfere with the normal behaviour of those services, while the actual performance can often be significantly affected by how those services are configured and fine-tuned for the specific application.

I think comparing the underlying stack and configuration first would give you a more accurate picture of where the performance difference is actually coming from.

(The explanation above, including this last comment, was polished by AI, because my English tends to sound a bit more blunt than I actually mean it to. :-))